KidzSearch Image Safe Search   


Example of a histogram of 100 normally distributed random values

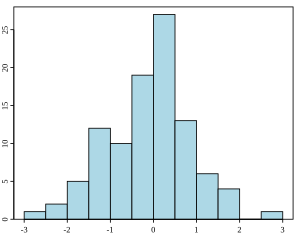
A histogram is a concept from statistics. It is a graphical display that tells us about the distribution of the samples involved. They are commonly a picture made from a table with many categories. The table tells how many samples there are in each category.

The word histogram is derived from histos and gramma in Greek. Histos means web or mast. Gramma means drawing, record or writing. A histogram of something is therefore, etymologically speaking, a drawing of the web of this something.

 view more...


   Related Content
    • histogram for kids
    • histogram vs bar graph for kids
    • histogram graph
    • histogram with normal distribution reference line
    • histogram for a camera
    • histogram worksheets


Not Finding Your Answer?
Post It On KidzTalk Homework Help


   Report a search problem


COMPANY RESOURCES LINKS SOCIAL
contact us education daily journal home facebook
about us make us your default search kidztalk twitter  
terms/privacy blocking websites kidznet pinterest  
advertise teacher zone wiki    
media link to us learning sites    
business / api solutions add a site image search    
affiliate program kidzsearch apps kidztube    
play youtube on kidzsearch games    
  voice search music    
  report a problem cool facts    
  settings news    
    search help    


 mobile version

      Copyright 2005-2024 KidzSearch.com