KidzSearch Image Safe Search   


A plot of a normal distribution (or bell curve). Each colored band has a width of one standard deviation.
A data set with a mean of 50 (shown in blue) and a standard deviation (σ) of 20.
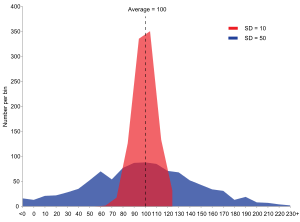
Example of two sample populations with the same mean and different standard deviations. Red population has mean 100 and SD 10; blue population has mean 100 and SD 50.

Standard deviation is a number used to tell how measurements for a group are spread out from the average (mean or expected value). A low standard deviation means that most of the numbers are close to the average, while a high standard deviation means that the numbers are more spread out.

 view more...


   Related Content
    • standard deviation practice problems and answers
    • standard deviation for kids


Not Finding Your Answer?
Post It On KidzTalk Homework Help


   Report a search problem


COMPANY RESOURCES LINKS SOCIAL
contact us education daily journal home facebook
about us make us your default search kidztalk twitter  
terms/privacy blocking websites kidznet pinterest  
advertise teacher zone wiki    
media link to us learning sites    
business / api solutions add a site image search    
affiliate program kidzsearch apps kidztube    
play youtube on kidzsearch games    
  voice search music    
  report a problem cool facts    
  settings news    
    search help    


 mobile version

      Copyright 2005-2024 KidzSearch.com