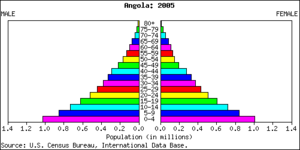
This is the population pyramid of
China for the year 2005.
In statistics, a frequency distribution is a list of the values that a variable takes in a sample. It is usually a list, ordered by quantity. It will show the number of times each value appears. For example, if 100 people rate a five-point Likert scale assessing their agreement with a statement on a scale on which 1 denotes strong agreement and 5 strong disagreement, the frequency distribution of their responses might look like:
| Rank | Degree of agreement | Number |
|---|
| 1 | Strongly agree | 25 |
| 2 | Agree somewhat | 35 |
| 3 | Not sure | 20 |
| 4 | Disagree somewhat | 15 |
| 5 | Strongly disagree | 5 |