KidzSearch Facts - Safe Search Engine     

   web | images | video | facts | wiki | news | games | kidztube | apps


Not Finding Your Answer?
Post It On KidzTalk Homework Help


   Report a search problem


COMPANY RESOURCES LINKS SOCIAL
contact us education daily journal home facebook
about us make us your default search kidztalk twitter  
terms/privacy blocking websites kidznet pinterest  
advertise teacher zone wiki    
media link to us learning sites    
business / api solutions add a site image search    
affiliate program kidzsearch apps kidztube    
play youtube on kidzsearch games    
  voice search music    
  report a problem cool facts    
  settings news    
    search help    


 mobile version

      Copyright 2005-2024 KidzSearch.com 

This graph shows the unemployment rate by year in the United States.

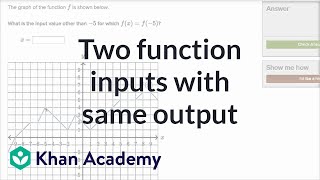
A graph is a picture designed to express words, particularly the connection between two or more quantities. You can see a graph on the right.


A simple graph usually shows the relationship between two numbers or measurements in the form of a grid. If this is a rectangular graph using Cartesian coordinate system, the two measurements will be arranged into two different lines at right angle to one another. One of these lines will be going up (the vertical axis). The other one will be going right (the horizontal axis). These lines (or axes, the plural of axis) meet at their ends in the lower left corner of the graph.

 view more...

How To Find Two Function Inputs With The Same Output Given Graph (example) | Khan Academy

How To Find Two Function Inputs With The Same Output Given Graph (example) | Khan Academy
How To Match Function Input To Output Given The Graph (example) | Algebra I | Khan Academy

How To Match Function Input To Output Given The Graph (example) | Algebra I | Khan Academy
How to spot a misleading graph - Lea Gaslowitz

How to spot a misleading graph - Lea Gaslowitz
more videos...